
Published on June 2, 2025
Illiquidity Premium: How Much Is It Worth in Private-Equity Returns?
Illiquidity Premium: Waiting for the Payoff
Private-equity managers have long argued that locking capital away for a decade deserves better payback than clicking “sell” on a brokerage screen. That incremental reward, known as the illiquidity premium, underpins everything from pension-fund allocations to carried-interest waterfalls. Yet the size of that premium, and whether it still compensates investors for lost flexibility, is moving from cocktail-party wisdom to data-driven debate.
Illiquidity Premium: Crunching the Long-Term Numbers
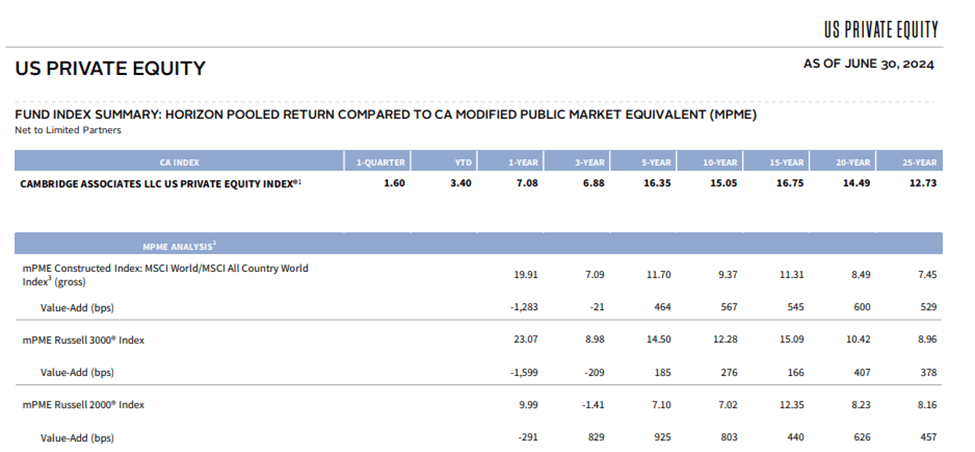
The headline figures still look generous. Cambridge Associates’ U.S. Private-Equity Index, which pools the cash flows of more than 1,600 buyout and growth-equity funds, delivered a 15.05% net IRR for the ten years to June 30 2024.1 On a “public-market equivalent” basis the same cash-flow pattern invested in the MSCI ACWI would have earned 9.37 %, leaving 567 basis points of excess return for going private.
Illiquidity Premium: Public Benchmarks Shrink the Spread
Stack those numbers against the yardstick most CIOs actually use, the S&P 500 total-return index, and the gap narrows but doesn’t disappear. YCharts puts the S&P 500’s ten-year annualised total return at 12.87 % through May 16 2025.2 That leaves roughly 218 basis points in PE’s favour after fees and carry, still meaningful, but far smaller than the double-digit premiums investors enjoyed a generation ago.
Illiquidity Premium: Recent Performance Wobbles
Short-term data tell a cautionary tale. McKinsey’s 2025 Global Private Markets Report shows industry-wide PE IRR slumping to 3.8 % for the nine months ended September 30 2024, while the S&P 500 racked up a 17 %-plus rally over roughly the same window. For the third time in four years, public markets beat private ones, reminding LPs that the illiquidity premium can disappear in any given vintage.
Illiquidity Premium: Skill and Selection Still Matter
Why does the long-run spread survive at all? Part of the answer is selection. Sponsors sit on proprietary deal flow and can lever it up cheaply, a combination that has historically turned operational alpha into IRR outperformance. Cambridge’s value-add table shows buyout funds adding roughly 600 basis points over public proxies across 15- and 20-year horizons, suggesting that skill does not fully expire with bull markets.
Illiquidity Premium: Illiquidity Carries Real Costs
But the premium also reflects tangible costs. Capital can be stranded for years, and secondary-market escape routes are rarely free. McKinsey notes that fund interests changed hands at 89 % of reported NAV in 2024—an eight-percentage-point discount despite a record $162 billion in secondary volume.3 Liquidity, in other words, still carries a price tag, and the bid-ask spread widens when distributions dry up.
Illiquidity Premium: Leverage and Hidden Volatility
Risk matters, too. Quarterly marks lag public prices and understate volatility, masking drawdowns that surface only when a sale closes at a lower multiple. Buyout leverage averaged 6.2 times EBITDA last year, Bain & Co. estimates, amplifying both upside and downside in a higher-rate era. Investors chasing the premium must therefore decide whether an extra two to five percentage points justifies capital calls that arrive precisely when listed markets are cheapest.
Illiquidity Premium: The Vintage Effect
Time, or more precisely, timing, also plays a role. The Cambridge data show the five-year PE return (16.35 %) outpacing its own ten-year number (15.05 %), a hint that 2014–19 vintage funds benefited from multiple expansion that may be hard to repeat. As exit backlogs swell and borrowing costs settle above pre-Covid norms, future returns will lean more on operational improvement than on financial engineering. That could compress the very premium LPs count on.
Illiquidity Premium: What Allocators Can Do
Treat illiquidity as a budget, not a free option. The more liquidity an institution truly needs, think pensions with ageing beneficiaries, the smaller the allocation that belongs in locked vehicles. Separate the gross premium from manager-specific alpha: fund dispersion is widening, and top-quartile persistence is eroding. Finally, negotiate harder on fees; a 2-and-20 structure when the gross premium is 500 basis points leaves precious little net spread.
Illiquidity Premium: Bottom Line
The illiquidity premium is neither myth nor windfall. Over the past decade it has been worth somewhere between two and six percentage points a year, depending on which public comparator you choose and how you measure risk. That is real money in a 5 % world, but it is far from guaranteed, and getting paid means living with cramped exit windows, lumpy cash flows, and leverage that cuts both ways.
Sources:
See the private market funds listed on our platform and learn how you can build customized portfolios for your clients.
For financial advisors only.