
Private equity industry trends
$4.11Tn
AuM as of June 2019.1
$495Bn
Capital distributed by fund managers to investors in 2018.2
86%
of PE investors plan to increase or maintain their commitment in the longer term.
Top Performing Institutional Investors are Allocating 40% to Private Investments
According to the latest research conducted by Cambridge Associates3, top decile performing institutional investors have increased their private investments* allocations to a mean of 40%.




*Private investments include non-venture private equity, venture capital, distressed securities (private equity structure), private real estate, private oil & gas/natural resources, timber, and other private investments.
¹Preqin; ²Preqin; ³Cambridge Associates Research Report February 2019; ⁴ Princeton University; ⁵ University of Texas; ⁶Columbia University; ⁷Yale News
The higher the allocation to private investments,
the better the returns.*
According to Cambridge Associate's endowment and foundation research, the average annualized return for a greater than 15% allocation was 8.1%, 160 basis points higher than the group with a less than 5% allocation.
20 year Average Return (%)
Private equity allocations under 5%
Private equity allocations between 5% and 15%
Private equity allocations over 15%
20 years Average Private Investment Allocations (%)
*Analysis includes 132 endowments and foundations that provided returns and beginning year asset allocation for each June 30 from 1998 to 2018. Subgroups are based on each institution's 20-year average allocation to private investments. Solid lines are drawn where the median private investments allocation for the entire universe with the median return for the entire universe.
**Private investments include non-venture private equity, venture capital, distressed security (private equity structure), private real estate, private oil & gas/natural resources, timber, and other investments. 10Endowment and foundation data as reported by Cambridge Associates LLC. Graphs are for illustrative purposes only.
The Private Company Universe
The private company universe is significantly larger than the shrinking public company universe, creating a host of opportunities.
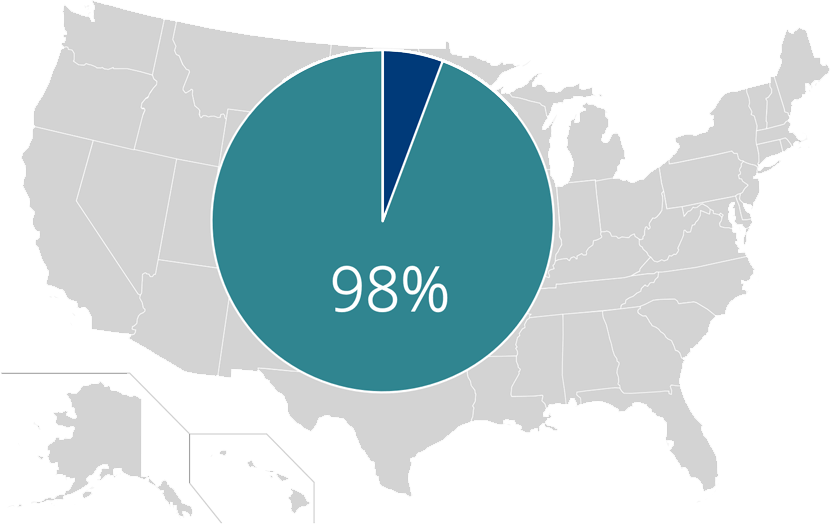
98%
of businesses with ≥ $10M in sales are not publicly traded in the USA
https://www.naics.com/custom-market-analysis-profiles
https://site.warrington.ufl.edu/ritter/files/Listed_19802019.pdf
46%
Decline in the number of US publicly traded companies since the 1997 peak
140k
Number of US
private companies
vs
4k
Number of US
public companies
The majority of a company's growth occurs in a private format.
Growing trend: private companies are skipping public markets entirely or going public much later as matured businesses.
The average age of a company at IPO has nearly doubled since 1980: 6 years old in 1980 and 10 years old in 2019 at IPO.
Initial Public Offerings: Median Age of IPOs Through 2017, June 13, 2018
Median age for tech companies going public in 1999 was 4 years, respectively, compared with 12 years in 2018.
Median annual sales, meanwhile, were about $12 million then, compared with $173.6 million last year at IPO .
https://www.wsj.com/articles/the-2019-ipo-frenzy-is-different-from-1999-really-11553918401
Demystifying common misconceptions
"TOO RISKY"
Single deal flow or a single manager approach is a recipe for disaster. Proper diversification greatly reduces the risk of permanent capital.
Probability of Portfolio with TVPI<1.0x Based on Portfolio Size
"TOO ILLIQUID; I'M TOO OLD"
Laddered consistently and periodically over 5 years (vintage diversification), a systematically designed PE portfolio should produce a staggered series of consistent cash flows and liquidity events for an investor, based on the assumptions* below.
Laddered Diversified PE Portfolio Cash Flows for $2.5M total commitments.
The cashflows in this graph are based on several assumptions, are for illustrative purposes only and cannot be relied upon. The timing and amounts of actual cash flows can vary widely from this illustration and there is no guarantee of performance results.
*The assumptions are 1) $250K is invested every 6 months over 5 years in a new fund 2) each fund calls 1/3 of committed capital per year 3) the average weighted life of an invested dollar is 4.5 years 4) a 1.6 net MOIC was the assumed growth of each invested dollar.
"TOO LATE IN THE CYCLE"
Professional investors do not attempt to time private markets. They take a systematic, process oriented approach and create a roadmap to advance steadily towards a ‘stabilized portfolio of private equity’ via systematic vintage diversification.
U.S. public vs. private equity returns
By vintage year
J.P. Morgan Asset Management Market Commentary, "Guid to Alternatives Q1, 2019"
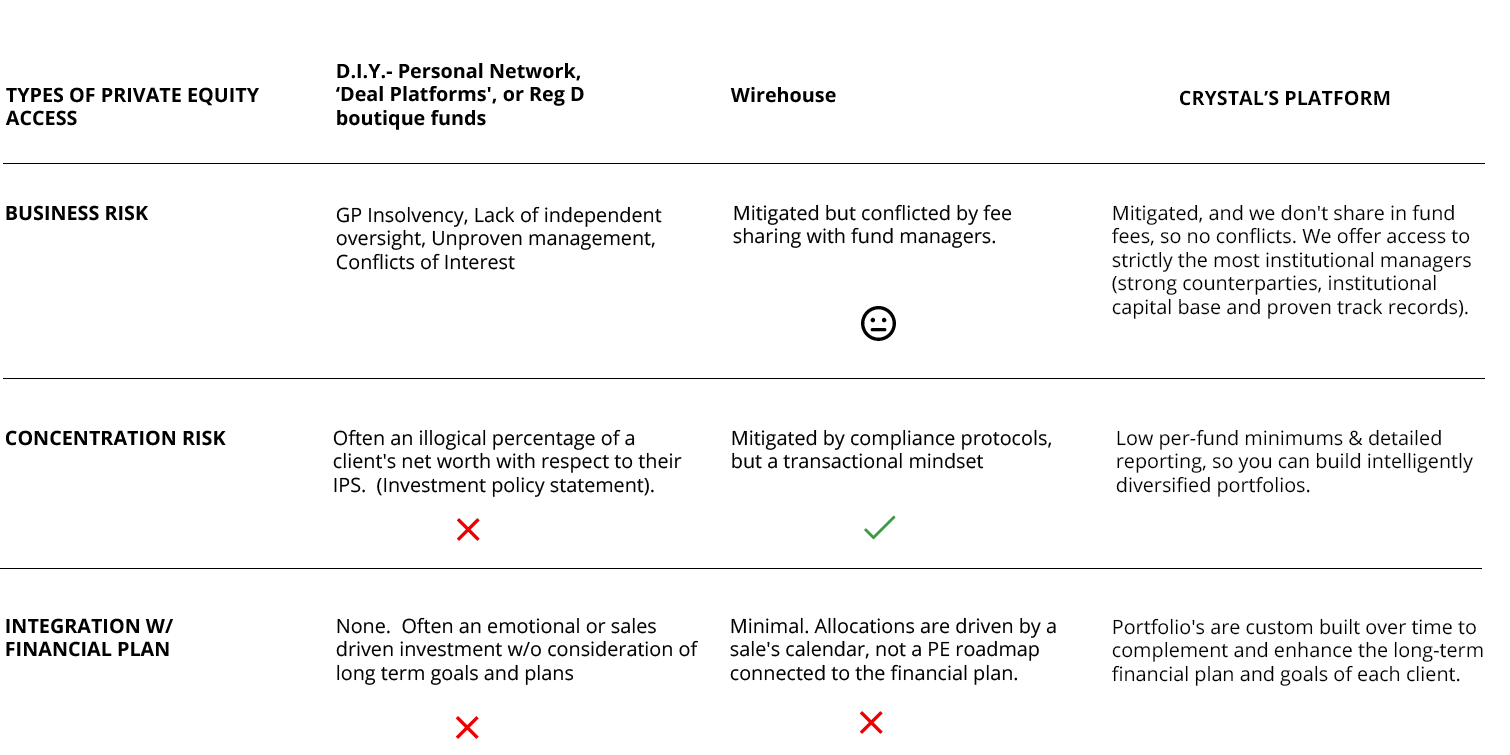
The Crystal Capital Private Equity offering provides you an edge in the marketplace.
Start your private equity investing journey now.
Our services are designed with financial professionals in mind.